4 Microscopy and track counting techniques
4.1 Microscope requirements
The microscope is the single most important component in a fission track dating laboratory but the choice of equipment is frequently not given the scrutiny it deserves. Any old microscope will not do. What is required is a research microscope of the highest quality fitted with objectives, condenser and illumination to give optimum performance at the highest magnifications (at least 1000x). Many microscopes used for fission track counting must also be used for petrographic work, and this can be done quite satisfactorily, but many petrographic microscopes are not well set up for work at very high magnifications. There are many advantages to setting up a microscope specifically for fission track work. Polarizing equipment and a rotating stage are not necessary for track counting and place significant restrictions on the other equipment that can be used on a microscope. For example, a much greater range of objective lenses can be used if they do not need to be strain free for use with polarized light. Also, most other microscope stages are more robust and have superior mechanical slide movements than do rotating stages.
There is a high degree of standardization between different microscope manufacturers so that most, for example, use a common threads, the international 45mm parfocal distance system and a 160mm mechanical tube length. This means that one manufacturer's lens will usually work quite well on another's microscope, which can be useful in putting a good microscope system together. The suppliers are quick to point out that this will usually not give optimum performance but you may find the difference is not at all critical.
Whatever microscope is used, it is essential that the microscope be kept well adjusted and the lenses clean. Special care is necessary to keep all exposed lens surfaces free from dust and protected from scratching and the effects of corrosive etchants, such as HF and strong alkalies, used to reveal fission tracks. Always wash samples thoroughly after etching and before placing them under the microscope.
4.2 Microscope Equipment
Illumination: For work at high magnifications it is necessary to have high intensity illumination available. Most research microscopes have light sources of 15W to greater than 100W. The low end of this range is generally inadequate for track counting and preferably a light source of 50W or more should be used. It is a considerable advantage to have both reflected and transmitted light illumination available on the microscope, arranged so that the user can switch back and forth between the two. Tracks are usually counted in transmitted light but reflected light can be useful for resolving complex track overlaps, locating the end of the track which intersects the surface, and for very high track densities. Reflected light can also be very useful for locating horizontal confined tracks used in length measurement (see section 4.5).
Condenser: The maximum resolution of a high magnification, high numerical aperture objective can only be achieved if the condenser lens has a similar performance and is correctly adjusted. A suitable condenser lens for high magnification is therefore essential and should have a numerical aperture of 0.9 or more.
Objectives: The array of objective lenses available from most microscope manufacturers can be quite bewildering and not all are equally suitable for fission track work. Different types of objectives have a variety of characteristics as regards their correction for spherical and chromatic aberration. In general it is more important to have flat-field objectives, such as planachromats, than those that have a very high degree of colour correction. However some lenses rate highly in both characteristics. Objectives should be parfocal with each other, and it is more convenient if they are mounted in a multiple revolving nosepiece rather than an individual bayonet-type objective carrier.
It is particularly important to avoid objectives that are corrected for use with a cover glass. This includes the vast majority of high magnification objectives, low power objectives being generally insensitive to cover glass thickness. Use of a cover glass corrected objective on an uncovered specimen gives a very poor image comparable to that obtained from an oil immersion objective without the oil.
Microscope objectives have their characteristics engraved on the side in the following form or something very like it:
Plan 40/0.65160/0.17
This means that the objective is a Planachromat with initial magnification of 40x; numerical aperture of 0.65; for use with a microscope of mechanical tube length of 160 mm and corrected for use with a cover glass of 0.17 mm thickness. Alternatively the last engraving may read /- if the lens is insensitive to cover glass thickness, or /0 if corrected for use with uncovered specimens. Often the engraving will also contain 'pol' or 'oil' identifying strain- free and oil-immersion objectives respectively.
An important question is whether to use dry or oil-immersion objectives for the highest magnifications. This is partly a matter of personal taste and both systems are in routine use in fission track laboratories. Technically, oil-immersion objectives have superior resolution but this is often outweighed by other effects. Very fine images are obtained under oil immersion in sphene and zircon which both have high refractive indices. However, in some other minerals, oil has distinct disadvantages because the refractive index of the usual immersion oil, 1.515, is almost the same as that of the mineral. In apatite and mica this results in the tracks losing contrast with the surrounding mineral and becoming much harder to observe. This problem cannot be avoided by using a different immersion medium because the objectives can only be used with an oil of the refractive index for which they were designed. For this reason it is often preferable to use dry objectives. Several manufacturers now supply high quality dry objectives for use at very high magnifications (e.g. Zeiss-100x, Nikon-100x, Leitz-160x).
Tube Factor: In most microscopes there is no change in magnification from any intermediate lenses in the microscope tube. Others may have a tube factor of 1.25x or even a variable magnification changer, such as the Zeiss OPTOVAR, giving a choice of 1.25x, 1.6x or 2x. Whilst not adding anything to the resolution of the system, such additional control over the total magnification of the system can be very useful in adjusting the track image for comfortable counting.
Eyepieces: A binocular eyepiece tube is regarded as an essential component of any microscope used for observing and counting fission tracks. The most commonly available eyepieces have magnifications of 10x, although higher magnifications, e.g. 12.5x or 15x, are often preferable for fission track work. Modern eyepieces are generally of the compensating type which can be used with the whole range of objectives, or at least those made by the same manufacturer. Increasingly they have a high-eyepoint, so that they can be used with spectacles if necessary. Wide angle and even ultra wide-angle types are also now available giving a greater field of view than standard eyepieces. This can be advantageous for fission track counting, although the ultra-wide types can be uncomfortable for viewing over any length of time. An example of a highly suitable eyepiece is the 12.5x wide angle Kpl made by Zeiss which gives a bright, clear image and is extremely comfortable to use over an extended counting session.
For counting fission tracks, one of the eyepieces must be a focusing type fitted with a graticule, usually in the form of a 10x10 grid. In the most commonly used graticules each grid square is 1mm across on the carrier disc. For track length measurements it is also necessary to have an eyepiece fitted with a scale bar or eyepiece micrometer. Calibration of the scale bar and the area of the graticule is carried out by measuring their dimensions against a stage micrometer, which can be obtained with divisions down to 2 μm. If such a calibration slide is not available then a satisfactory alternative is to use a piece of optical diffraction grating, although this requires incident light illumination as the metallic coating of the grating is opaque. Diffraction gratings are accurately ruled with very fine lines, at a known spacing of the order of 1 μm apart. On some binocular eyepiece tubes the total magnification is affected slightly by the interpupillary spacing. If this is the case then the calibration of the graticule and scale bar will be specific to a particular setting of the spacing and care should be taken to ensure the same setting is always used.
During fission track counting it is often useful to be able to rotate the eyepiece so that the graticule can be lined up in the most convenient orientation relative to the specimen. This can be achieved by simply removing the small locating screw which is used to prevent rotation on some types of eyepiece.
4.3 Identification of Fission Tracks
In order to count fission tracks it is obviously necessary that they can be reliably identified and distinguished from etch pits of other origins, such as dislocations. Etched fission tracks have certain properties which enable their discrimination from spurious pits. These are as follows (Fleischer and Price 1964), the first three being the most important in practice:
- Etched fission tracks must be straight because fission-fragments travel essentially in straight lines. Occasional exceptions to this are found where a fission fragment has undergone an elastic collision with a matrix nucleus. The track may then be deflected and the recoil nucleus often leaves a short track, branching to one side. Such events are rare, however, and are still readily identified as tracks.
- Fission fragments have a limited range of about 5-10 μm, depending on the matrix material, which is controlled by the energy released in the fission process. Etched fission tracks, therefore, can have only a limited length, up to the maximum etchable range of both fission fragments. The maximum track length is characteristic of each mineral and varies from about 10-20 μm.
- Fission tracks must be randomly oriented, showing no preferred relationship to any crystallographic direction. Anisotropic etching can lead to an apparent preferred orientation but this is a selective etching phenomenon and not related to the actual distribution of unetched tracks.
- Unetched fission tracks have a limited thermal stability that is characteristic of the registering material, and usually different from that of dislocations.
- The distribution of spontaneous tracks must be statistically the same as that of uranium, and hence of induced tracks in a particular material.
In contrast, dislocation etch pits are often bent, branching, curved or wavy, and they often occur in swarms, the distribution of which is unrelated to that of uranium. The lengths of dislocations are frequently all similar to each other and often much greater than those of fission tracks. Commonly, dislocations occur with a strongly preferred orientation, either as sub-parallel swarms, or as lines of parallel etch channels. Dislocations may act as nucleation sites for the precipitation of impurities from the host material, in which case they are readily identified.
Dislocations are most commonly encountered in large numbers in relatively young volcanic apatites, although seldom in all grains in a mount. Figure 4.1 shows the appearance of such high concentrations of etched dislocations in some apatite grains, and a relatively dislocation-free grain in the same mount. In such cases the population method cannot be applied because grains containing many dislocations are best avoided entirely. Quite reliable ages can be obtained, however, from the dislocation-free grains using the external detector method. Apatites from slowly cooled plutonic rocks usually show few, if any, dislocations and discrimination is quite simple.
Zircons and sphenes tend to have relatively few dislocation etch pits and discrimination is not usually any problem. Zircons can contain minute crystalline inclusions that can sometimes be mistaken for tracks, especially where the fossil track density is very low. Often such crystallites show a regular orientation in relation to some crystallographic direction that can aid in their discrimination.
In general, the problems of discriminating fission tracks from other etch features are not severe, but they can become significant for very low track densities. It is always an advantage when there are sufficient tracks present to enable them to be compared with each other. Experience and an appropriate selection of dating technique are important in handling difficult cases, but it may be wiser to simply go on to another sample.
In contrast, dislocation etch pits are often bent, branching, curved or wavy, and they often occur in swarms, the distribution of which is unrelated to that of uranium. The lengths of dislocations are frequently all similar to each other and often much greater than those of fission tracks. Commonly, dislocations occur with a strongly preferred orientation, either as sub-parallel swarms, or as lines of parallel etch channels. Dislocations may act as nucleation sites for the precipitation of impurities from the host material, in which case they are readily identified.
Dislocations are most commonly encountered in large numbers in relatively young volcanic apatites, although seldom in all grains in a mount. Figure 4.1 shows the appearance of such high concentrations of etched dislocations in some apatite grains, and a relatively dislocation-free grain in the same mount. In such cases the population method cannot be applied because grains containing many dislocations are best avoided entirely. Quite reliable ages can be obtained, however, from the dislocation-free grains using the external detector method. Apatites from slowly cooled plutonic rocks usually show few, if any, dislocations and discrimination is quite simple.
Zircons and sphenes tend to have relatively few dislocation etch pits and discrimination is not usually a problem. Zircons can contain minute crystalline inclusions that can sometimes be mistaken for tracks, especially where the fossil track density is very low. Often such crystallites show a regular orientation in relation to some crystallographic direction that can aid in their discrimination.
In general, the problems of discriminating fission tracks from other etch features are not severe, but they can become significant for very low track densities. It is always an advantage when there are sufficient tracks present to enable them to be compared with each other. Experience and an appropriate selection of dating technique are important in handling difficult cases, but it may be wiser to simply go on to another sample.

Figure 4.1: Apatite grains from a Cretaceous volcanogenic sandstone showing the swarms of dislocations which are often found in such materials. Most of the etched features seen in grains (a) and (b) are dislocations whereas grain (c), from the same rock, shows only well-etched spontaneous fission tracks. All three photographs are at the same scale, the horizontal dimension of each frame being about 150 μm.
4.4 Counting Techniques
Microscope work for a fission track age determination involves the counting of three track densities: spontaneous, induced and standard glass. For each of these the tracks are normally counted at magnifications of 1000x, or more, and usually in transmitted light. The depth of focus under these conditions is very limited so that the fine focus of the microscope needs to be moved up and down frequently during counting to follow the 3-dimensional nature of each track.
The position of a track in relation to the counting graticule is defined by the intersection of the track with the surface. With experience, this surface-end of the track can be recognised at a glance but at first should be judged from the following characteristics. All the tracks (long and short) will only be in focus together at the surface, so that progressively fewer tracks will be seen as the focus is moved down into the material. Moving the fine focus up and down can therefore be used to identify the surface-end of the tracks. Also, the intersection of each track with the surface is clearly visible as a dark hole in reflected light, if this is available. Even in transmitted light the two ends of a track do not look the same and can be identified.
On internal and external detector surfaces the tracks vary in length from essentially zero up to the maximum for the particular mineral. It is important not to overlook the smallest tracks, or at least to use some consistent criterion as to which of the short tracks will be included. Counting the tracks then involves systematically scanning across an appropriate number of grid squares, so that each track is included once and once only. Where the surface intersection of the track lies exactly on a grid line, some convention must be used to assign the track to a particular grid square. For example a track might be included in a square if it lies along the top or right hand edge, but not if it is on the bottom or left hand edge.
Recording the number of tracks counted takes the observer's attention away from the microscope image and therefore significantly increases the time spent at the microscope. It is therefore inefficient to record large numbers of small counts and much better to accumulate larger counts (20-100) before recording them. The best way to keep track of large counts is to use a hand tallying device.
Standard Glass: The standard glasses used for neutron dosimetry have uniform uranium concentrations so that their corresponding mica detectors receive a uniform track density, usually over a large area of about 1 cm2. The tracks in each mica should be counted on a regular pattern covering the whole available area. The simplest method is to move around the mica on a regular 1 mm or 0.5mm grid and at each location count the tracks in a predetermined area of the graticule. The number of locations and the number of grid squares counted at each will depend on the track density. Typically tracks are counted at more than 20 locations (up to 100) to give a total track count of at least 1000. It is good practice to count each glass at least twice to verify the track density obtained and to increase the precision on the combined measurement. The track density (per cm2) is determined from the total number of tracks and the total area counted.
At least two standard glasses are usually included in each irradiation package, at top and bottom of the dating mounts, to monitor any flux gradients. If a significant and reproducible difference is found in standard glass track density along the irradiation canister, then an intermediate value should be interpolated for each mount in the package.
Population Method: In the population method the spontaneous and induced tracks are counted in exactly the same way in two separate mounts. For each track density a predetermined area of the graticule is randomly placed over each grain and the tracks counted. It is important that the counting area is positioned independently of the distribution of tracks as the counting can easily be biased towards areas with high or low track densities. A simple precaution against such bias is to select a position on each grain with the image slightly out of focus. In this way the outline of the grain and any other features to be avoided, such as large cracks or inclusions, remain visible but the distribution of tracks cannot be seen until the counting area is in position and the surface refocused. Ideally the measurement is made by scanning across the mount and counting on every grain encountered, but in practice a few grains invariably have to be bypassed for various reasons, such as bad fracturing. This should not affect the track density as long as the grains are not rejected on the basis of their track count. Counts are usually accumulated over 100-300 grains and the average track density determined from the total tracks counted divided by the total area.
External Detector method: To determine the ratio of spontaneous to induced tracks identical areas are counted on each mineral grain and its mica detector image. The sequence of steps is to select a suitable grain, count the spontaneous tracks, locate its mirror image on the mica and count the induced tracks. Before counting an external detector mount it is wise to scan the mica at low power to check that the detector had remained in close contact with the mount during irradiation. Grains with good contact have sharp, clearly defined boundaries to their induced track images in the mica. Areas of poor contact, indicated by diffuse, rounded grain image boundaries should be avoided as they will give an underestimate for the induced track density.
Suitable grains for counting are selected on the basis of having well etched tracks, sharp polishing scratches, uniform track density and minimum interference from inclusions, cracks and dislocations. Where spontaneous track densities are low, the numbers of tracks in each grain, and the apparent single grain ages, can vary substantially due to the natural statistical variation of the decay process. It is very easy to select only the grains with relatively more tracks, but this can lead to a seriously biased age. In such cases it is important that grains are selected covering the whole range of variation, even including grains with no tracks if they are present. Having selected a suitable grain the fossil tracks are counted, avoiding the zone within one track range of any external crystal face. It may be useful to sketch the position of the area counted relative to the grain outline on a piece of graph paper.
Locating the corresponding area on the mica can be carried out manually, although this is extremely tedious and mistakes are easily made. It can be extremely difficult to locate the equivalent mirror-image point on the mica detector corresponding to the grain selected for counting. Mistakes in locating mirror image pairs of areas for counting spontaneous and induced tracks may be common and can result in erroneous ages. Manual selection of areas for counting by the External Detector method is facilitated by preparing an enlarged photographic image of the mount as a guide, or by using measured stage coordinates to locate the required induced track grain images. The position of grains selected for counting can be conveniently recorded by pin-pricking the photomap and labelling on the back. The photomap is now used with the microscope at low power as a key to the grain outlines in the induced track image, which should be visible provided a high enough neutron fluence was given. Once the image of a particular grain is located the counting area is positioned in exactly the same relative position (mirror imaged) as was used for the spontaneous tracks, and the induced tracks counted. However, the time-consuming task of locating matching points on the grain mount and its external detector is now mostly automated using a computer-controlled microscope stage system, as described under 4.6, below.
4.5 Track Length Measurements
A variety of different parameters can and have been used in fission track dating studies to estimate the distribution of track lengths (e.g. Bhandari et al. 1971, Wagner and Storzer 1972, Dakowski 1978). Some of these studies have measured the projected length or full length (i.e. corrected for dip) of surface intersecting tracks. It is becoming increasingly clear, however, that such measurements contain little useful information about the true length distribution (Dakowski 1978, Green 1981, Laslett et al. 1982). A much better procedure is to measure the lengths of 'confined' tracks which do not intersect the surface, but have been etched from an intersection with another track or a fracture. These tracks are called TINTs (track-in-track) and TINCLEs (track-in-cleavage) after Lal et al.(1969), who first suggested their use.
To reveal the greatest number of suitable confined tracks it is best to etch a sample for about twice the initial plateau value, \( E_{min}\). Only tracks with rounded or angular ends should be measured, indicating that the etchant has penetrated right to the end of the track to reveal its full length. Care should be taken that the mount is clean and dry, as liquids, especially oils from greasy fingerprints, can lodge in the end of a track making it very difficult to see. Washing the mount in a strong detergent will usually clear the tracks. Examples of well- etched confined tracks in apatite are shown in Figure 4.2.
In principle it is possible to measure both the horizontal and vertical components of the length of confined tracks to give their actual length, regardless of their orientation. In practice, however, the vertical distance is not easily measured and reduces the precision of the overall measurement. A simpler and more rigorous procedure is to select only those confined tracks which are effectively horizontal and to measure their total length directly. Such measurements have the closest relationship to the true length distribution and are less subject to inherent sampling bias than other parameters (Laslett et al. 1982). Horizontal tracks can be readily identified as those which are in focus along their entire length under a high power objective. In reflected light, horizontal tracks are very obvious because they have a very bright reflection, without the diffraction bands which characterise shallowly dipping tracks. Scanning in reflected light can be a very useful way to locate suitable horizontal confined tracks for measurement.
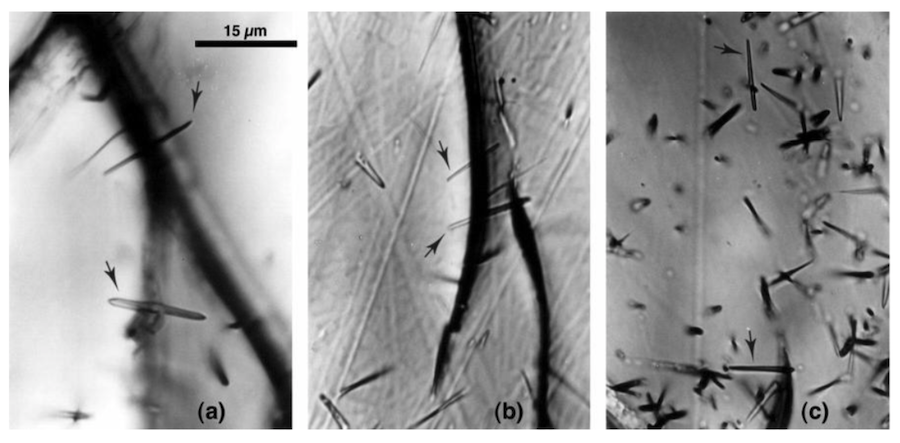
Figure 4.2: Confined fission tracks in apatite which are used for length measurements. Two TINCLEs are indicated by arrows in frames (a) and (b), while frame (c) shows one TINT (top) and one TINCLE (bottom). The confined tracks are all spontaneous tracks.
Track length measurements are today mostly automated, although the task of locating suitable confined tracks for measurement must still be left to the operator. The actual measurement is accomplished by the use of a drawing tube attachment to the microscope and a digitizing tablet attached to a computer. The drawing tube superimposes an image of the digitizing tablet with its cursor on the usual microscope image. The cursor carries a bright Light-emitting diode to mark the measuring point in the optical image. Once a suitable track is located the cursor is simply moved to each end of the image of the track in turn and its position marked. The raw coordinates for the track ends are processed by the controlling software and the track length data accumulated for recording and display. The sample mount should be scanned systematically and the lengths of the confined tracks measured. Most of the time is spent locating suitable tracks, but with experience it should take no more than about one hour to locate and measure 50-100 tracks in a typical mount.
4.6 Automation of the External Detector Method
The time-consuming task of locating matching points of the grain mount and its external detector is now mostly automated using a computer-controlled microscope stage system, such as that supplied by Autoscan Systems Pty Ltd (www.autoscan.com). Such automated stage systems are now universally used for the external detector method and provide a much faster and more reliable technique for accurately and repeatedly locating matching points on a mica external detector. An automated stage system leads to a very significant increase in overall productivity by significantly reducing the time spent at the microscope on unproductive grain location tasks and maximising the time actually counting and measuring tracks. The original stage system was developed in the Melbourne Laboratory (Gleadow et al., 1982, Smith and Leigh-Jones, 1985) and similar approaches have been also been developed elsewhere (e.g. Crowley and Young, 1988). Another advantage of such automated methods is that they provide a framework for the systematic collection, organization of the fission track data that are collected.
With an automated stage the control computer prompts the operator through a series of steps which very rapidly teach it the relative positions of the mineral mount and its external detector. From then on the stage will move back and forth between exactly matching points on the mount and its detector whenever desired. A refocusing mechanism is also included which automatically adjusts for the height difference between the mount and detector whenever a translation is made from one to the other. The coordinates of all points labelled for counting are recorded to a disc file relative to a zero reference mark on each slide. If desired a mount can be reinserted into the slide carrier at a later date and the labelled points inspected again by recalling the coordinates from the disc file. The whole task of grain image location is thus completely automated and the system leads to an approximately fivefold increase in productivity, compared to manual counting times.
The sequence of steps to be followed using an automated stage systems usually involves the following steps:
- Finding and marking the zero reference point
- Coarse alignment of the mount and detector using the pin-pricks
- Refinement of the alignment using mineral grains and their induced track images
- Selection and labelling of suitable grains for counting
- Counting of spontaneous and induced tracks over each grain
- Measurement of confined track lengths as these are observed
- Saving all of the data to a computer file
A typical layout of the mineral mount, detector and zero point on a microscope slide used for automated position location is illustrated in Figure 4.2. A zero reference point is also marked on, or attached to, the microscope slide to which all position coordinates are referred (Step 1). In preparation for the automated procedure a needle is used to make several large pin-pricks through the external detector into the mineral mount once the detector is fixed in place prior to irradiation. These large pin-holes are easily identified and serve as the primary location points which enable a coarse relative alignment of the mount and detector to be established (Step 2). The initial alignment is achieved by driving the stage, using a joy-stick controller to one of the pin-hole on the mount, then driving to the equivalent hole on the detector. This is then repeated for another pin-hole, preferably at an opposite corner of the mount. Given that the mount and detector images are exactly the same size and mirror- images of each other, the software is now able to calculate their approximate positions relative to the initially marked zero point. This initial alignment is then refined using actual pairs of grains and their induced track images on the detector, until a very precise alignment is obtained (Step 3). The system is capable of operating in three axes, so that relative offsets in x, y and z, as well as rotations of the mica relative to the mount can be corrected for by automated movements of the stage.
Once the alignment procedure is completed, the stage system retains an exact knowledge of the positions of matching points on the mineral mount and their mirror-image positions on the mica detector, and can move between these whenever required. A typical counting session then begins by selecting a series of suitable grains on the mount and electronically recording their positions (step 4). The spontaneous tracks can then be counted in each grain before an automatic translation of the stage brings the precise matching point on the detector into view so that the corresponding induced tracks can be counted (Step 5). Most modern systems also allow for the measurement of confined track lengths at any time that these are encountered (step 6), before all the fission track data are saved to a disc file (Step 7).
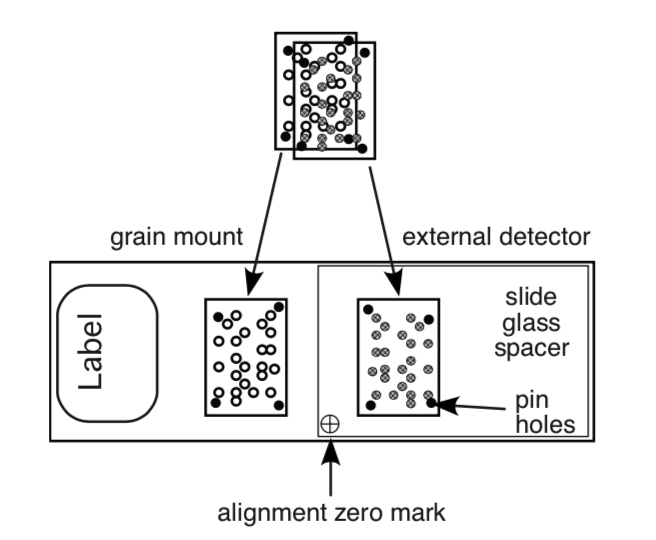
Figure 4.3: Diagram showing the way in which a mineral mount and its mica external detector are attached to a microscope slide for counting. The large dots on each represent pin-pricks made through the mica into the mount surface once the detector was attached to the mount prior to irradiation. These serve as initial location points to teach the computer system the relative position so the mount and its corresponding detector.
4.7 Digital Imaging and Automated Fission Track Analysis
New analytical approaches are now promising significant improvements in data quality and analytical productivity in fission track analysis. Gleadow et al (2009) have described a method that combines autonomous digital microscopy and automatic image analysis for the recognition and counting of fission tracks in minerals such as apatite, along with new tools for the enhanced measurement of fission track lengths. This new technique takes full advantage of the capabilities of athe new generation of digital microscopes, such as the Zeiss Axio-Imager series. Much of the operator time previously tied to the microscope is now freed to do other things as the microscope/software system captures and processes the images autonomously, without the need for operator involvement after the first setting up has been completed. Multiple slides can be imaged overnight, and the processed images analysed offline on a computer using the analysis software. Digital coordinates of analysed grains are exported to other computer operated devices such as a Laser-ablation stage, or an Electron Microprobe, for further analysis.
The technology at the heart of the new analytical system is called ‘Coincidnece Mapping’ (Gleadow et al. 2009), a new image analysis technique that combines the information in digital images captured in reflected and transmitted light. In most cases, the only features that occur in both images sets are the fission tracks (Figure 4.4). A variety of other image analysis techniques are also used to filter and prepare the images for successful analysis and assist the operator with track dimension measurements. Once the automated count is completed the analysis software presents the results overlaid on the actual images for final review and correction where necessary by the operator.

Figure 4.4: sequence of digital images showing, from left to right, a transmitted light image, a reflected light image and a coincidence mapped image that shows the identified track etch pits in black. These particular images show fission tracks in mica. The image capture is carried out autonomously without intervention from the operator, and the image analysis is completed in a few seconds for each field of view, with the results presented to the operator for final review.
This new approach can work quite well with the External Detector Method, but has particular advantages when combined with LA-ICP-MS for uranium determination on the same grains. Laser-ablation is a destructive technique on a micro-scale, so the use of captured digital image sets preserves a permanent record of the fission tracks even after the grain has been partially destroyed.