1. Introduction
During the late 1950s and early 1960s it was discovered that heavy charged particles passing through insulating materials could leave trails of radiation damage (Silk and Barnes, 1958, Price and Walker 1962a). Initial observations of these trails were made by transmission electron microscopy, but only with difficulty because the tracks tended to fade whilst being observed under the electron beam. It was soon discovered, however, that the damage trails could be fixed and enlarged by a simple process of chemical etching until they could be seen under an ordinary optical microscope (Price and Walker, 1962b). This simple method of visualising the radiation damage has made possible a proliferation of applications which have been extensively reviewed, together with much of the basic theory of nuclear track studies, by Fleischer, Price and Walker (1975). One of these applications is fission track dating which with increased understanding of the thermal stability of fission tracks has subsequently evolved into the field of Fission Track Thermochronology (see Hurford, 2019).
Nuclear tracks produced by the fragments from the fission of a heavy nucleus, such as \(^{238}U\), are called fission tracks. Each fission event produces a single etched track because the two fragments fly apart at 180° to each other, producing a continuous line defect. Counting the number of tracks on an etched surface gives a quantitative measure of the number of fission events that have occurred. Fossil fission tracks, due to the spontaneous fission of \(^{238}U\) over geological time, were first observed in natural micas by Price and Walker (1962c). The number of such fossil, or spontaneous, tracks in a uranium-bearing mineral is proportional to both the time over which tracks have been accumulating, and the uranium concentration of the mineral. If the uranium concentration and the \(^{238}U\) spontaneous fission rate are known, the number of spontaneous tracks can be used to calculate a geological age.
The uranium concentration can be simply measured by irradiating the sample with a known dose of thermal neutrons. This induces fission in a fraction of the less-abundant \(^{235}U\) nuclei to produce a new set of tracks that can be etched and counted in the same way as spontaneous tracks. These induced tracks are related to the \(^{238}U\) concentration through the known \(^{235}U/^{238}U\) ratio in natural uranium. The geological age can be determined from the ratio of spontaneous to induced track densities, which is directly analogous to measuring the ratio of daughter to parent isotopes in other radiometric dating systems. Determining a fission track age, therefore, consists essentially of measuring the fission track density in a uranium-bearing material before and after a thermal neutron irradiation. The neutron fluence is usually monitored by counting tracks from a standard glass 'dosimeter' containing a known, highly uniform uranium concentration, irradiated together with the specimens to be dated. These dosimeter tracks are best measured, not in the glass itself, but in a sheet of mica held firmly in contact with it during the irradiation.
The most commonly used materials in fission track dating are apatite, zircon, sphene and, to a lesser extent, natural glasses. Typical uranium concentrations and the range of applicability of these materials are illustrated in Figure 1.1. Other minerals such as epidote, garnet and various micas are also used, but are much less important in routine applications because of their generally low uranium concentrations. In general, glasses are only useful for the more recent geological past and their analysis and interpretation is made difficult by their variable and very low track stabilities. The discussion here will largely be restricted to the most useful minerals, apatite, zircon and sphene, although the techniques described could be readily adapted to other minerals where appropriate.
Numerous reviews of fission track analysis and thermochronology have been written over the years, each empahsising different aspects of the methods involved, and the principles and techniques used for interpretation of results. The reader is referred to extensive reviews by Gallagher et al. (1998), Gleadow et al. (2002), Kohn et al. (2005), Donelick et al. (2005), Tagami and O’Sulivan (2005), Lisker et al. (2009) and Gleadow and Seiler, (2015) for an account of the modern field of fission track thermchronology and its interpretive framework. No coverage is attempted here of the general problems of track stability, and the interpretation and application of fission track ages. These fields are now the subject of a substantial literature which could not be reviewed adequately here. The reader is therefore referreed to the above review articles and a series of books by Wagner and Van den Haute (1992), Galbraith (2005), Braun et al (2006), and Malusa and Fitzgerald (2019) covering details of the theory, methods, statistics and interpretational strategies required for a comprehensive introduction to the field.
The emphasis of this manual is on the practical techniques of fission track dating for geological applications, and their theoretical basis rather than interpretation and modeling of results. Step by step details of sample preparation procedures are included as an appendix. The techniques described here and the philosophy behind them are those developed in the Fission Track Laboratory of the School of Earth Sciences, University of Melbourne, over many years. As such, they are adapted to local practices, equipment and facilities, but wherever possible they are discussed in a more general context and should be readily adaptable to other laboratory environments. Modern overviews of these methods are provided by Donelick et al. (2005) and Kohn et al. (2019).
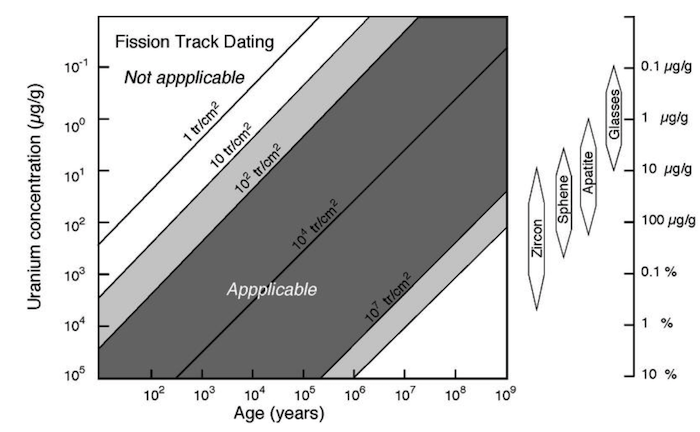
Figure 1.1:Diagram showing the relationship between sample age, uranium concentration and fission track density. The suitability of a sample for fission track dating is essentially determined by the spontaneous track density, the acceptable range being indicated by the dark grey region. Minerals can be counted over the range from about 104 to 107 cm\(^{-2}\), whereas glasses can be counted down to 100 cm\(^{-2}\), because of the larger areas available for counting. The light grey regions are countable but only with difficulty. Modified after Wagner (1978).